Prometheus on EKS: What to Alert On (and What Not)
By Muhammad Soliman
TL;DR. Prometheus on EKS is easy to install and easy to make noisy. Community kube-prometheus-stack gives you thousands of series and a long default rule set, and none of that tells you which alert deserves a page. Page only on symptoms users feel: crash loops, pods stuck Pending, nodes NotReady, volumes about to fill, API server and DNS error ratios. Put capacity forecasts in a ticket queue and everything else on a dashboard. Keep series cardinality bounded, keep local retention short and ship long-term history elsewhere, and route every alert to a runbook. The PromQL below is a starting point you own, not a finished rule set.
- Page: a user-facing symptom with a clear first action.
- Ticket: a trend that will become an outage in days, such as a volume filling at its current rate.
- Dashboard: causes, saturation and everything else. No pager, no channel noise.
Start from the defaults, then cut them
Installing kube-prometheus-stack gives you Prometheus Operator, node-exporter, kube-state-metrics, Grafana and Alertmanager, wired together and carrying a large default rule set. That is a good foundation. It is also a source of noise, because a default rule set is written for every cluster, and your cluster is not every cluster.
The first task after install is subtraction. Read the list of firing and pending alerts after a week of normal traffic. Anything that fired and produced no action goes in the bin or gets tuned. Anything that never fired is still worth a look, because a rule that cannot fire may be pointed at a metric your cluster does not emit.
The Prometheus alerting guide gives the test in one line: keep alerting simple, alert on symptoms, have good consoles to allow pinpointing causes, and avoid pages where there is nothing to do. The rest of this post applies that test to EKS.
Alert on what users feel
A symptom is a change users would notice. A cause is a change in a component that may or may not reach users. CPU at 80 percent is a cause. A slow checkout is a symptom. Page on symptoms, and use causes to explain them once the page has fired.
On EKS, the symptoms that have paid off most often are these:
- Workload health. A crash loop is never a normal state for a production workload. An OOM kill is the most common explanation for "it was working yesterday".
- Scheduling. A pod that stays Pending for five minutes is usually an exhausted node group, a taint nobody removed, or a PersistentVolumeClaim that will not bind.
- Capacity. A volume at 85 percent used with a growth rate that will fill it within a day is a page. The same volume at 85 percent with flat usage is a ticket.
- Nodes. A node that stops reporting Ready takes its pods with it, and the scheduler has to find room elsewhere.
- Control plane, as seen from the workload. You do not run the EKS control plane, but you feel its bad days through API errors and webhook timeouts.
- Certificates. An expiry warning days ahead turns a silent renewal failure into a ticket.
- DNS. When CoreDNS starts returning SERVFAIL, many other alerts fire at once. A DNS alert tells you which page to read first.
The rule set
The rules below use the names and labels that the Prometheus Operator and kube-state-metrics expose. Each one has a severity label, which the Alertmanager routing later uses. Adjust the namespace pattern to match your own naming.
apiVersion: monitoring.coreos.com/v1
kind: PrometheusRule
metadata:
  name: workload-health
  namespace: monitoring
  labels:
    release: prometheus   # match your Prometheus ruleSelector
spec:
  groups:
    - name: workload-health
      rules:
        - alert: PodCrashLooping
          expr: |
            kube_pod_container_status_waiting_reason{reason="CrashLoopBackOff", namespace=~"prod-.*"} == 1
          for: 10m
          labels:
            severity: critical
          annotations:
            summary: "{{ $labels.namespace }}/{{ $labels.pod }} is crash looping"
            runbook_url: https://runbooks.prometheus-operator.dev/runbooks/kubernetes/kubepodcrashlooping/
        - alert: ContainerOOMKilled
          expr: |
            (kube_pod_container_status_last_terminated_reason{reason="OOMKilled"} == 1)
              and on (namespace, pod, container)
            increase(kube_pod_container_status_restarts_total[15m]) > 0
          labels:
            severity: warning
          annotations:
            summary: "{{ $labels.namespace }}/{{ $labels.pod }} was OOM killed"
        - alert: PodPendingTooLong
          expr: sum by (namespace, pod) (kube_pod_status_phase{phase="Pending"}) > 0
          for: 5m
          labels:
            severity: warning
          annotations:
            summary: "{{ $labels.namespace }}/{{ $labels.pod }} has been Pending for 5 minutes"
        - alert: NodeNotReady
          expr: kube_node_status_condition{condition="Ready", status="true"} == 0
          for: 5m
          labels:
            severity: critical
          annotations:
            summary: "Node {{ $labels.node }} has not been Ready for 5 minutes"
        - alert: PersistentVolumeFillingUp
          expr: |
            (kubelet_volume_stats_available_bytes / kubelet_volume_stats_capacity_bytes) < 0.15
              and predict_linear(kubelet_volume_stats_available_bytes[6h], 4 * 3600) < 0
          for: 30m
          labels:
            severity: warning
          annotations:
            summary: "PVC {{ $labels.persistentvolumeclaim }} in {{ $labels.namespace }} will fill within 4 hours"
        - alert: KubeAPIServerErrorRatio
          expr: |
            sum(rate(apiserver_request_total{code=~"5.."}[5m]))
              / sum(rate(apiserver_request_total[5m])) > 0.03
          for: 10m
          labels:
            severity: warning
          annotations:
            summary: "More than 3 percent of API server requests are failing with 5xx"
        - alert: CoreDNSServfailRatio
          expr: |
            sum(rate(coredns_dns_responses_total{rcode="SERVFAIL"}[5m]))
              / sum(rate(coredns_dns_responses_total[5m])) > 0.02
          for: 10m
          labels:
            severity: critical
          annotations:
            summary: "More than 2 percent of CoreDNS responses are SERVFAIL"
A few notes on these rules:
for:is the noise filter. A 30-second spike is weather. A ten-minute condition is a trend. Every paging rule should have afor:long enough to rule out a rollout that is still settling.- The OOM rule is a warning, not a page. An OOM kill on a workload that restarts cleanly is a sizing problem. It becomes a page only when the crash loop rule fires alongside it.
- The volume rule uses
predict_linear. The first condition says the volume is nearly full. The second says the current growth rate will empty the remaining space within four hours. Both have to hold, which keeps a nearly full but stable volume out of the pager. - The API server and DNS rules are ratios, not counts. A count grows with traffic. A ratio tells you whether the error share is rising.
Cert-manager also exposes certificate state through its own metrics endpoint. Its documentation does not list an expiry metric by name on the page we checked, so confirm the exact metric name on your cert-manager version's /metrics endpoint before you write the expiry rule. The rule itself is the same shape as the volume rule: a timestamp minus the current time, compared with 20 days.
Three tiers, and what goes in each
The rules above belong to three tiers, and the tier decides where the signal goes.
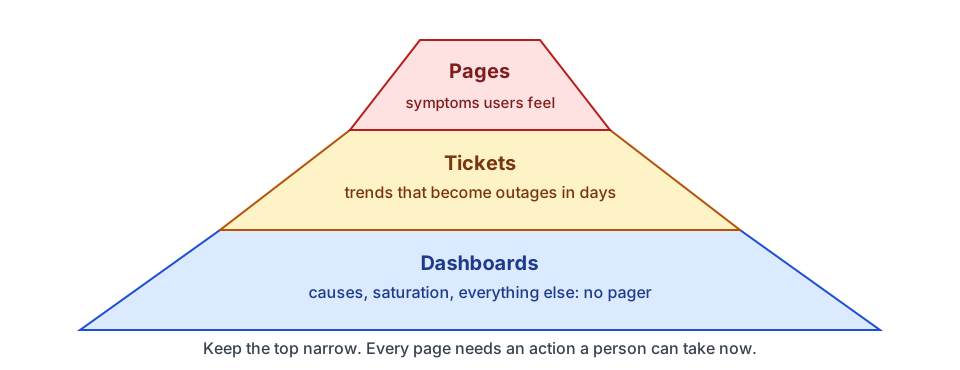 Alert tiers: few pages, a ticket queue for trends, and dashboards for causes
The pyramid is narrow at the top on purpose. Every page should be something a person can act on right now. If a team gets more pages than it can answer during a working day, most of those pages are in the wrong tier. Move them down to tickets or dashboards before you tune the thresholds.
From signal to action
Each alert needs a path from the metric to a decision. The flow below is the path the rule set above follows. An alert fires when the expression stays true for the for: duration. Alertmanager then groups, routes, and inhibits it before it reaches a person.
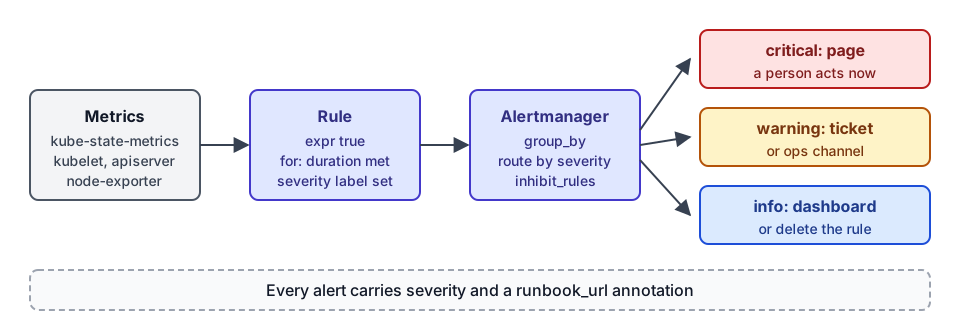 From metric to decision: every alert carries a severity and a runbook link
The routing configuration in Alertmanager is where severity turns into behavior. The example below uses the route, receivers and inhibit_rules structure from the Alertmanager configuration reference.
route:
  receiver: ticket-queue
  group_by: [alertname, cluster, namespace]
  group_wait: 30s
  group_interval: 5m
  repeat_interval: 4h
  routes:
    - matchers:
        - severity="critical"
      receiver: pager
    - matchers:
        - severity="warning"
      receiver: ops-channel

receivers:
  - name: pager
    pagerduty_configs:
      - routing_key: <integration-key-from-secret>
  - name: ops-channel
    slack_configs:
      - channel: "#ops-warnings"
  - name: ticket-queue
    webhook_configs:
      - url: https://tickets.example.com/alertmanager

inhibit_rules:
  # When DNS is failing, silence warning-level alerts from the same cluster.
  - source_matchers:
      - alertname="CoreDNSServfailRatio"
    target_matchers:
      - severity="warning"
    equal: [cluster]
The group_by labels decide which alerts arrive together. Grouping by alertname, cluster and namespace turns forty pod alerts from one bad rollout into one notification. The inhibition rule implements the DNS case from earlier: the DNS alert explains the timeouts, so the timeouts do not need their own notifications.
Every alert should carry a runbook_url annotation, even when the runbook is short. A runbook that says "check the events, then check the image tag" still shortens the next page.
Cardinality is the cost you do not see
Prometheus memory use follows the number of active series. A series is a unique combination of metric name and label values, and the count grows with every new label value. The failures that look like memory leaks are usually label mistakes.
The common case is a histogram with per-pod labels. A histogram with 12 buckets, labeled by pod, on a workload with 50 replicas has 600 series for one metric. A rollout creates new pod names, so the series count climbs with every deploy, and the old series stay in memory until they age out of the head block.
Three rules keep the count bounded:
- Template high-cardinality values. Request paths should be routes such as
/orders/:id, not raw URLs. User IDs, request IDs and pod names do not belong in histogram labels. - Drop series you never query. Relabeling can remove noisy kube-state-metrics series before they are stored. Check which ones your dashboards and rules use first.
- Audit the top metrics. When memory trends up, run
topk(10, count by (__name__)({__name__=~".+"}))to find the metrics with the most series, and fix the largest first.
Retention, and where history lives
Prometheus keeps local data for 15 days by default when neither the time nor the size retention flag is set, according to the storage documentation. For an in-cluster Prometheus whose job is alerting and recent debugging, a shorter window of seven to fifteen days is usually enough. Longer windows cost disk and make WAL replay after a restart slower.
Long-term history belongs in remote storage. Prometheus can write samples to a remote endpoint over the Remote Write protocol, and the same documentation describes that integration. Amazon Managed Service for Prometheus, Thanos and Mimir are the common choices on AWS. Pick one by cost and by how much query history your team needs.
This split has a useful side effect. If the in-cluster Prometheus is disposable, it can be rebuilt from manifests when a node group is recycled, and nothing that matters is lost. History lives in the remote store, and alert rules live in Git.
Control-plane signals on EKS
EKS runs the control plane for you, so you cannot scrape it the way you scrape a node. You can still read the API server's own metrics, including apiserver_request_total, and the AWS guide for Prometheus describes a managed scraper that collects control-plane metrics for Amazon Managed Service for Prometheus. The AWS documentation also notes that scrapers created before November 2024 that use the aws-auth ConfigMap need an update to read the additional control-plane metrics.
Use the control-plane metrics for the error ratio rule above and for a latency view on the dashboard. Do not try to build a page on control-plane internals that you cannot change. The page should say that the API is failing for your workload. The root cause is then AWS's to fix, and your job is to tell the user and to keep the rest of your stack steady.
Three dashboards, not three hundred
Grafana is most useful with three dashboards per audience:
- Fleet overview. Is anything on fire across all clusters? One row per cluster, with the page-tier alerts at the top.
- Cluster drill-down. What is on fire here? Node health, pending pods, volume headroom, control-plane error ratio, CoreDNS responses.
- Workload view. Is my service healthy? Restarts, OOM kills, replica readiness and the user-facing latency and error rate for that service.
Vanity metrics such as request counts and business KPIs belong in the workload view, where they help a team understand its own service. They do not belong on the on-call overview, where they compete with the signals that need attention.
How SeaGit handles this
SeaGit's cluster documentation lists twelve add-ons. The cluster setup guide recommends four for production: the ALB controller, cert-manager, External DNS and Prometheus. The Prometheus entry is described as a monitoring and alerting toolkit. In the getting started guide, Metrics Server is shown as checked and Prometheus as an optional add-on.
Two limits matter for this post:
- The platform's metrics add-on installs the Metrics Server chart, version 3.12.2, which provides resource metrics for
kubectl topand autoscaling. It does not provide the alerting rules in this post. - The docs do not describe a default PrometheusRule set for the Prometheus add-on. Treat the rules above as your starting point. Confirm the add-on's current state on your cluster page before you rely on it, and apply the rules through your own GitOps repository so they stay under review.
When a rule fires, the troubleshooting guide covers the usual causes for CrashLoopBackOff, OOMKilled and Pending pods, which is a good place to start the runbook. For the DNS alert, the DNS field guide on this blog walks through the ndots and search-path causes behind the timeouts that often follow a CoreDNS failure.
Frequently asked questions
What should I alert on in Kubernetes?
Alert on symptoms users feel: crash loops, pods stuck Pending, nodes that stop reporting Ready, volumes that will fill soon at their current rate, API server and CoreDNS error ratios, and certificates close to expiry. Leave raw CPU and memory thresholds on dashboards unless a runbook can name the action they require.
Why is my Prometheus using so much memory?
Almost always cardinality. Memory follows the number of active series, and labels with unbounded values such as pod names, request paths or user IDs multiply the count, especially during rollouts. Template or drop those labels, remove series you never query, and find the largest metrics with a topk query over series counts.
How long should Prometheus keep data on EKS?
For the in-cluster instance, seven to fifteen days is usually enough for alerting and recent debugging. Send long-term history to remote storage such as Amazon Managed Service for Prometheus, Thanos or Mimir. The default local retention is 15 days when no retention flag is set.
How do I stop alert fatigue?
Route by severity, so only critical alerts page a person. Give each alert a for: duration long enough to ignore brief spikes. Add inhibition rules so one root cause does not fire dozens of alerts. Attach a runbook to every alert, and delete any alert that fires repeatedly without leading to an action.
Sources
- Alerting, Prometheus documentation, checked October 2026
- Configuration, Alertmanager documentation, checked October 2026
- KubePodCrashLooping runbook, kube-prometheus runbooks, checked October 2026
- Storage, Prometheus documentation, checked October 2026
- Monitor your cluster metrics with Prometheus, Amazon EKS User Guide, checked October 2026
- Metrics documentation, kube-state-metrics, checked October 2026